CEWA 568 Snow Hydrology - Spring 2023#
Lab 2-3: Kettle Ponds snow pillow and snow depth (from lidar) precipitation.#
Written by Eli Schwat (elilouis@uw.edu) - December 2024.
Library imports#
# import libraries we'll need
import urllib
import pandas as pd
import datetime as dt
import xarray as xr
import matplotlib.pyplot as plt
import os
%matplotlib inline
Open SoS Data#
sos_file = "../data/sos_full_dataset_30min.nc"
sos_dataset = xr.open_dataset(sos_file)
Before plotting, we resample the SoS dataset by finding the daily mean. We don’t need the 30 minute data to look at season long changes. Also, the snow pillow dataset has lots of nans so resampling makes the plot look better. The precipitaton dataset is already daily, so we don’t need to resample it.
# You can do the resampling yourself
# sos_dataset_daily = sos_dataset.resample(time="1440Min").mean()
# Or you can open the already resampled dataset. We include this pre-resampled dataset so the website renders the notebooks nicely.
sos_dataset_daily = xr.open_dataset("../data/sos_full_dataset_daily.nc")
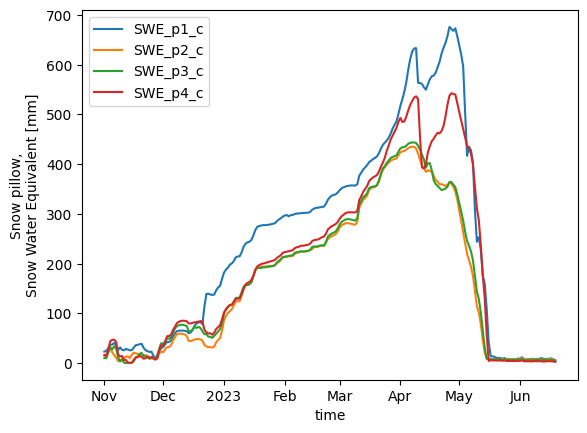
Now we plot the data. Note that SWE_p1_c, SWE_p2_c, SWE_p3_c, SWE_p24_ corresponse to the snow pillows beneath towers UW, UE, C, D, respectively.
sos_dataset_daily['SWE_p1_c'].plot(label='SWE_p1_c')
sos_dataset_daily['SWE_p2_c'].plot(label='SWE_p2_c')
sos_dataset_daily['SWE_p3_c'].plot(label='SWE_p3_c')
sos_dataset_daily['SWE_p4_c'].plot(label='SWE_p4_c')
plt.legend()
plt.ylabel("Snow pillow,\nSnow Water Equivalent [mm]")
plt.show()
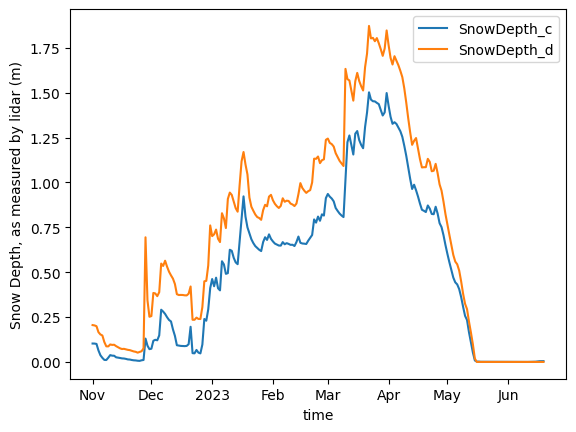
We have snow depth measurements from two towers - towers C and D.
This corresponds to snow pillows p3 and p4, i.e. the variable SnowDepth_c corresponds to the measurements of snow depth over the snow pillow variable SWE_p3_c and the variable SnowDepth_d corresponds to the measurements of snow depth over the snow pillow variable SWE_p4_c.
sos_dataset_daily['SnowDepth_c'].plot(label='SnowDepth_c')
sos_dataset_daily['SnowDepth_d'].plot(label='SnowDepth_d')
plt.legend()
plt.ylabel("Snow Depth, as measured by lidar (m)")
plt.show()
Calculate snow density#
We can calculate snow density (kg/\(m^3\)) by dividing SWE (in mm of water) by the snow depth (in \(m\)).
How does this conversion work?
Consider that SWE is measuring the depth of water. Consider that depth of water over a 1x1 \(m^2\) area, which gives us a volume of water. The density of water (approximately 1000 kg/m^3) gives us the weight of the water in the 1x1 \(m^2\) area. Using the snow depth, we know the volume of snow over that area, which allows us to estimate the snow density.
Because the units are complicated here, I personally would use some python code to ensure my units are correct here. Using this feature allows me to ignore the differences in units between SWE (in our dataset as mm) and snow depth (in our dataset as m). Look up the pint and metpy.units python packages if you are interested in learning more about this functionality. I give a demo below.
# !pip install metpy
!pip install pint_xarray
Requirement already satisfied: pint_xarray in /opt/hostedtoolcache/Python/3.11.14/x64/lib/python3.11/site-packages (0.6.0)
Requirement already satisfied: xarray>=2023.07.0 in /opt/hostedtoolcache/Python/3.11.14/x64/lib/python3.11/site-packages (from pint_xarray) (2026.2.0)
Requirement already satisfied: numpy>=1.26 in /opt/hostedtoolcache/Python/3.11.14/x64/lib/python3.11/site-packages (from pint_xarray) (2.4.2)
Requirement already satisfied: pint>=0.24 in /opt/hostedtoolcache/Python/3.11.14/x64/lib/python3.11/site-packages (from pint_xarray) (0.25.2)
Requirement already satisfied: flexcache>=0.3 in /opt/hostedtoolcache/Python/3.11.14/x64/lib/python3.11/site-packages (from pint>=0.24->pint_xarray) (0.3)
Requirement already satisfied: flexparser>=0.4 in /opt/hostedtoolcache/Python/3.11.14/x64/lib/python3.11/site-packages (from pint>=0.24->pint_xarray) (0.4)
Requirement already satisfied: platformdirs>=2.1.0 in /opt/hostedtoolcache/Python/3.11.14/x64/lib/python3.11/site-packages (from pint>=0.24->pint_xarray) (4.9.2)
Requirement already satisfied: typing-extensions>=4.0.0 in /opt/hostedtoolcache/Python/3.11.14/x64/lib/python3.11/site-packages (from pint>=0.24->pint_xarray) (4.15.0)
Requirement already satisfied: packaging>=24.1 in /opt/hostedtoolcache/Python/3.11.14/x64/lib/python3.11/site-packages (from xarray>=2023.07.0->pint_xarray) (26.0)
Requirement already satisfied: pandas>=2.2 in /opt/hostedtoolcache/Python/3.11.14/x64/lib/python3.11/site-packages (from xarray>=2023.07.0->pint_xarray) (2.3.3)
Requirement already satisfied: python-dateutil>=2.8.2 in /opt/hostedtoolcache/Python/3.11.14/x64/lib/python3.11/site-packages (from pandas>=2.2->xarray>=2023.07.0->pint_xarray) (2.9.0.post0)
Requirement already satisfied: pytz>=2020.1 in /opt/hostedtoolcache/Python/3.11.14/x64/lib/python3.11/site-packages (from pandas>=2.2->xarray>=2023.07.0->pint_xarray) (2026.1.post1)
Requirement already satisfied: tzdata>=2022.7 in /opt/hostedtoolcache/Python/3.11.14/x64/lib/python3.11/site-packages (from pandas>=2.2->xarray>=2023.07.0->pint_xarray) (2025.3)
Requirement already satisfied: six>=1.5 in /opt/hostedtoolcache/Python/3.11.14/x64/lib/python3.11/site-packages (from python-dateutil>=2.8.2->pandas>=2.2->xarray>=2023.07.0->pint_xarray) (1.17.0)
from metpy.units import units
from metpy.constants import density_water
import pint_xarray
density_water
snowdensity_c = (
    sos_dataset_daily['SWE_p3_c']*units("mm")
).pint.to("m") * density_water / (
    sos_dataset_daily['SnowDepth_c'] * units("m")
)
snowdensity_c[:-35].plot()
[<matplotlib.lines.Line2D at 0x7face268bf50>]
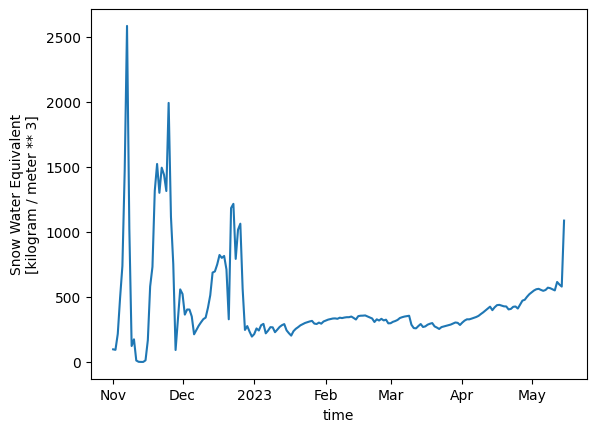
What do we think about the high values early in the season? Are they believable? What could be causing them?