Lab 4-1: Snowpack temperature profiles#
Written by Daniel Hogan - April, 2023.
Modified by Jessica Lundquist - April, 2023.
Modified by Eli Schwat - January 2024.
import xarray as xr
import numpy as np
import os
import urllib
import pandas as pd
import datetime as dt
import matplotlib.pyplot as plt
SOS Data#
sos_file = "../data/sos_full_dataset_30min.nc"
sos_dataset = xr.open_dataset(sos_file)
tsnow_vars = [v for v in sos_dataset if 'Tsnow_' in v and v.endswith('_d')]
snow_depth_vars = ['SnowDepth_d']
print(snow_depth_vars, tsnow_vars)
['SnowDepth_d'] ['Tsnow_0_4m_d', 'Tsnow_0_5m_d', 'Tsnow_0_6m_d', 'Tsnow_0_7m_d', 'Tsnow_0_8m_d', 'Tsnow_0_9m_d', 'Tsnow_1_0m_d', 'Tsnow_1_1m_d', 'Tsnow_1_2m_d', 'Tsnow_1_3m_d', 'Tsnow_1_4m_d', 'Tsnow_1_5m_d']
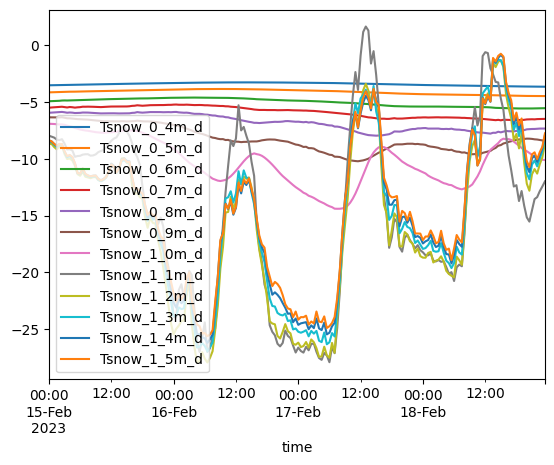
Plotting measurements from the in-snow thermistors.#
An array of thermistors measured temperatures both above and below the snow throughout the measurement campaign.
These measurements are in the following variables:
tsnow_vars = [
    'Tsnow_0_4m_d',
    'Tsnow_0_5m_d',
    'Tsnow_0_6m_d',
    'Tsnow_0_7m_d',
    'Tsnow_0_8m_d',
    'Tsnow_0_9m_d',
    'Tsnow_1_0m_d',
    'Tsnow_1_1m_d',
    'Tsnow_1_2m_d',
    'Tsnow_1_3m_d',
    'Tsnow_1_4m_d',
    'Tsnow_1_5m_d'
]
tsnow_data = sos_dataset[tsnow_vars]

tsnow_data = tsnow_data.to_dataframe()
Let’s visualize temperatures measured by all the thermistors on a few days in February.
tsnow_data.loc['20230215': '20230218'].plot()
<Axes: xlabel='time'>
In the Module 4 labs, I will also use the plotting library Altair. I find Altair often makes it simpler to create more complex visualizations. The equivalent plot, made in Altair, is shown below.
!pip install altair
Requirement already satisfied: altair in /opt/hostedtoolcache/Python/3.11.14/x64/lib/python3.11/site-packages (6.0.0)
Requirement already satisfied: jinja2 in /opt/hostedtoolcache/Python/3.11.14/x64/lib/python3.11/site-packages (from altair) (3.1.6)
Requirement already satisfied: jsonschema>=3.0 in /opt/hostedtoolcache/Python/3.11.14/x64/lib/python3.11/site-packages (from altair) (4.26.0)
Requirement already satisfied: narwhals>=1.27.1 in /opt/hostedtoolcache/Python/3.11.14/x64/lib/python3.11/site-packages (from altair) (2.17.0)
Requirement already satisfied: packaging in /opt/hostedtoolcache/Python/3.11.14/x64/lib/python3.11/site-packages (from altair) (26.0)
Requirement already satisfied: typing-extensions>=4.12.0 in /opt/hostedtoolcache/Python/3.11.14/x64/lib/python3.11/site-packages (from altair) (4.15.0)
Requirement already satisfied: attrs>=22.2.0 in /opt/hostedtoolcache/Python/3.11.14/x64/lib/python3.11/site-packages (from jsonschema>=3.0->altair) (25.4.0)
Requirement already satisfied: jsonschema-specifications>=2023.03.6 in /opt/hostedtoolcache/Python/3.11.14/x64/lib/python3.11/site-packages (from jsonschema>=3.0->altair) (2025.9.1)
Requirement already satisfied: referencing>=0.28.4 in /opt/hostedtoolcache/Python/3.11.14/x64/lib/python3.11/site-packages (from jsonschema>=3.0->altair) (0.37.0)
Requirement already satisfied: rpds-py>=0.25.0 in /opt/hostedtoolcache/Python/3.11.14/x64/lib/python3.11/site-packages (from jsonschema>=3.0->altair) (0.30.0)
Requirement already satisfied: MarkupSafe>=2.0 in /opt/hostedtoolcache/Python/3.11.14/x64/lib/python3.11/site-packages (from jinja2->altair) (3.0.3)
import altair as alt
alt.Chart(
    tsnow_data.loc['20230215': '20230218'].reset_index() # we have to reset the index b/c altair cannot work with an index, it needs `time` as a column
).mark_line().transform_fold(
    tsnow_vars,
    as_ = ['thermistor', 'temperature']
).encode(
    alt.X('time:T'),
    alt.Y('temperature:Q'),
    alt.Color('thermistor:O').sort(tsnow_vars),
    tooltip = 'thermistor:O' # try hovering our mouse over lines in the plot
).properties(width=400)
In later plots, you will see how altair often makes things easier than matplotlib.
The plot above is interesting, but we are interested in looking at the soil temperature profiles as a vertical profile. To do that, we will have to manipulate the data a bit.
Extracting snow temperature data for vertical profiles#
Steps to manipulate dataset#
We create a dataset that conveniently re-organizes the snowpack temperature measurements for visualization.
The snowpack temperature sensors were at fixed locations above the ground. The snow, which varies in height above ground level (AGL), buries different sensors at different times. To remove data points, we use the snowdepth measurements (in time) to calculate the depth of each temperature sensor (at a given height AGL) relative to the snow surface height (AGL). We then remove any data points from temperature sensors (and timestamps) above the snow surface.
# Transform the NetCDF dataset to be a "tidy" dataset of snow depths
snow_temp_dataset = sos_dataset[
    tsnow_vars + snow_depth_vars
].to_dataframe().reset_index().set_index(['time', 'SnowDepth_d']).melt(ignore_index=False)

# Calculate the depth of the snow sensor (relative to the snow surface)
# using the snow depth measurements and the known above-ground height
# of the snow sensors, which is built into the variable name
snow_temp_dataset['height_agl'] = snow_temp_dataset['variable'].str[6:9].str.replace('_', '.').astype(float)
snow_temp_dataset = snow_temp_dataset.reset_index().set_index('time')
snow_temp_dataset['depth'] = snow_temp_dataset['height_agl'] - snow_temp_dataset['SnowDepth_d']
# remove measurements NOT in the snowpack
snow_temp_dataset = snow_temp_dataset.query("depth < 0")
snow_temp_dataset
| SnowDepth_d | variable | value | height_agl | depth | |
|---|---|---|---|---|---|
| time | |||||
| 2022-11-28 01:00:00 | 0.423657 | Tsnow_0_4m_d | -9.056437 | 0.4 | -0.023657 |
| 2022-11-28 01:30:00 | 0.461395 | Tsnow_0_4m_d | -10.109233 | 0.4 | -0.061395 |
| 2022-11-28 02:00:00 | 0.499132 | Tsnow_0_4m_d | -9.103524 | 0.4 | -0.099132 |
| 2022-11-28 02:30:00 | 0.536870 | Tsnow_0_4m_d | -10.318118 | 0.4 | -0.136870 |
| 2022-11-28 03:00:00 | 0.574608 | Tsnow_0_4m_d | -11.310650 | 0.4 | -0.174608 |
| ... | ... | ... | ... | ... | ... |
| 2023-04-09 11:00:00 | 1.509988 | Tsnow_1_5m_d | -2.090520 | 1.5 | -0.009988 |
| 2023-04-09 11:30:00 | 1.506667 | Tsnow_1_5m_d | -2.059685 | 1.5 | -0.006667 |
| 2023-04-09 12:00:00 | 1.503345 | Tsnow_1_5m_d | -2.046416 | 1.5 | -0.003345 |
| 2023-04-09 12:30:00 | 1.501286 | Tsnow_1_5m_d | -1.991756 | 1.5 | -0.001286 |
| 2023-04-10 03:00:00 | 1.500064 | Tsnow_1_5m_d | -1.185983 | 1.5 | -0.000064 |
47089 rows × 5 columns
# Add surface temperature data (depth=0)
surface_temps_dataset = sos_dataset['Tsurf_d'].to_dataframe()
surface_temps_dataset = surface_temps_dataset.rename(columns={'Tsurf_d': 'value'})
surface_temps_dataset['depth'] = 0
surface_temps_dataset
| value | depth | |
|---|---|---|
| time | ||
| 2022-11-01 00:00:00 | NaN | 0 |
| 2022-11-01 00:30:00 | NaN | 0 |
| 2022-11-01 01:00:00 | NaN | 0 |
| 2022-11-01 01:30:00 | NaN | 0 |
| 2022-11-01 02:00:00 | NaN | 0 |
| ... | ... | ... |
| 2023-06-19 15:30:00 | 23.838074 | 0 |
| 2023-06-19 16:00:00 | 22.595795 | 0 |
| 2023-06-19 16:30:00 | 21.681244 | 0 |
| 2023-06-19 17:00:00 | 20.645264 | 0 |
| 2023-06-19 17:30:00 | NaN | 0 |
11074 rows × 2 columns
snow_temp_dataset = pd.concat([snow_temp_dataset, surface_temps_dataset])
Plotting snow temperature profiles.#
For these plots, I think the altair plotting library is easiest.
src = snow_temp_dataset.sort_index().loc['20230204': '20230204'].reset_index()

alt.Chart(
    src.assign(hour = src.time.dt.hour)[src.time.dt.minute == 0][src.time.dt.hour % 3 == 2]
).mark_line(point=True).encode(
    alt.X('value:Q').title('T (˚C)'),
    alt.Y('depth:Q'),
    alt.Color('hour:O').scale(scheme='rainbow'),
    alt.Facet('date(time):O', columns=1),
    order='depth'
).properties(width=200, height = 200)
/tmp/ipykernel_2707/975513592.py:4: UserWarning: Boolean Series key will be reindexed to match DataFrame index.
  src.assign(hour = src.time.dt.hour)[src.time.dt.minute == 0][src.time.dt.hour % 3 == 2]
src = snow_temp_dataset.sort_index().loc['20230314': '20230314'].reset_index()
alt.Chart(
    src.assign(hour = src.time.dt.hour)[src.time.dt.minute == 0][src.time.dt.hour % 4 == 2]
).mark_line(point=True).encode(
    alt.X('value:Q').title('T (˚C)'),
    alt.Y('depth:Q').title('depth (m)'),
    alt.Color('hour:O').scale(scheme='rainbow'),
    alt.Facet('date(time):O', columns=3),
    order='depth'
).properties(width=200, height = 200, title = '20230312')
/tmp/ipykernel_2707/598782676.py:3: UserWarning: Boolean Series key will be reindexed to match DataFrame index.
  src.assign(hour = src.time.dt.hour)[src.time.dt.minute == 0][src.time.dt.hour % 4 == 2]
src = snow_temp_dataset.sort_index().loc['20230312': '20230314'].reset_index()
alt.Chart(
    src.assign(hour = src.time.dt.hour)[src.time.dt.minute == 0][src.time.dt.hour % 3 == 2]
).mark_line(point=True).encode(
    alt.X('value:Q').title('T (˚C)'),
    alt.Y('depth:Q').title('depth (m)'),
    alt.Color('hour:O').scale(scheme='rainbow'),
    alt.Facet('date(time):O', columns=3),
    order='depth'
).properties(width=200, height = 200)
/tmp/ipykernel_2707/3393511937.py:3: UserWarning: Boolean Series key will be reindexed to match DataFrame index.
  src.assign(hour = src.time.dt.hour)[src.time.dt.minute == 0][src.time.dt.hour % 3 == 2]
src = snow_temp_dataset.sort_index().loc['20230407': '20230412'].reset_index()
alt.Chart(
    src.assign(hour = src.time.dt.hour)[src.time.dt.minute == 0][src.time.dt.hour % 3 == 2]
).mark_line(point=True).encode(
    alt.X('value:Q').title('T (˚C)'),
    alt.Y('depth:Q').title('depth (m)'),
    alt.Color('hour:O').scale(scheme='rainbow'),
    alt.Facet('date(time):O', columns=3).title(None).header(format='April %d'),
    order='depth'
).properties(width=150, height = 150,
            #  title='Vertical Temperature Profiles in Snowpack'
             title=alt.TitleParams(text='Vertical Temperature Profiles in Snowpack', anchor='middle')
            )
/tmp/ipykernel_2707/2499543566.py:3: UserWarning: Boolean Series key will be reindexed to match DataFrame index.
  src.assign(hour = src.time.dt.hour)[src.time.dt.minute == 0][src.time.dt.hour % 3 == 2]