Course Project: CEWA 568#
The goal of the course project is to give you hands-on experience exploring a snow hydrology topic of particular interest to you. The project will consist of an oral presentation (20% of total) and written report (80% of total).
Final Project Due Dates#
Please take note of these due dates early on in the semester, as they serve as progress checks towards your final project.
Initial Project proposal (Due January 23) - Please write a few sentences stating the research question you would like to explore. If you would like to work with a partner, include the name of your partner, or specify you will be doing the project alone. Describe the concept you want to explore and the measurements (dataset) you want to use. If you have questions about the project, now is the time to talk to the instructor.
Midterm Progress Report (Due February 20) - Write a document that includes: a clearly-stated research question, a description of the methods you are using, as well as some initial results. At least one research paper/reference should be identified by this point.
Presentations (Due March 13) - Students will present on March 13. Please submit your slides before the beginning of class.
Final Reports (Due March 13) - Due by 11:59pm on March 13.
See the Syllabus page for due dates.
Potential project ideas…#
Explore variability in the snow surface temperatures measured by multiple instruments at Kettle Ponds.
Explore wind speed thresholds for initiation of suspended and blowing snow using wind speed and blowing snow measurements at Kettle Ponds.
Examine the snowpack structure and associated avalanche risk using snowpit data from Kettle Ponds.
Test the performance of simple snowpack compaction models using snow pillow and snow depth measurements from Kettle Ponds.
Diagnose the snow energy balances residual problem
Rubric#
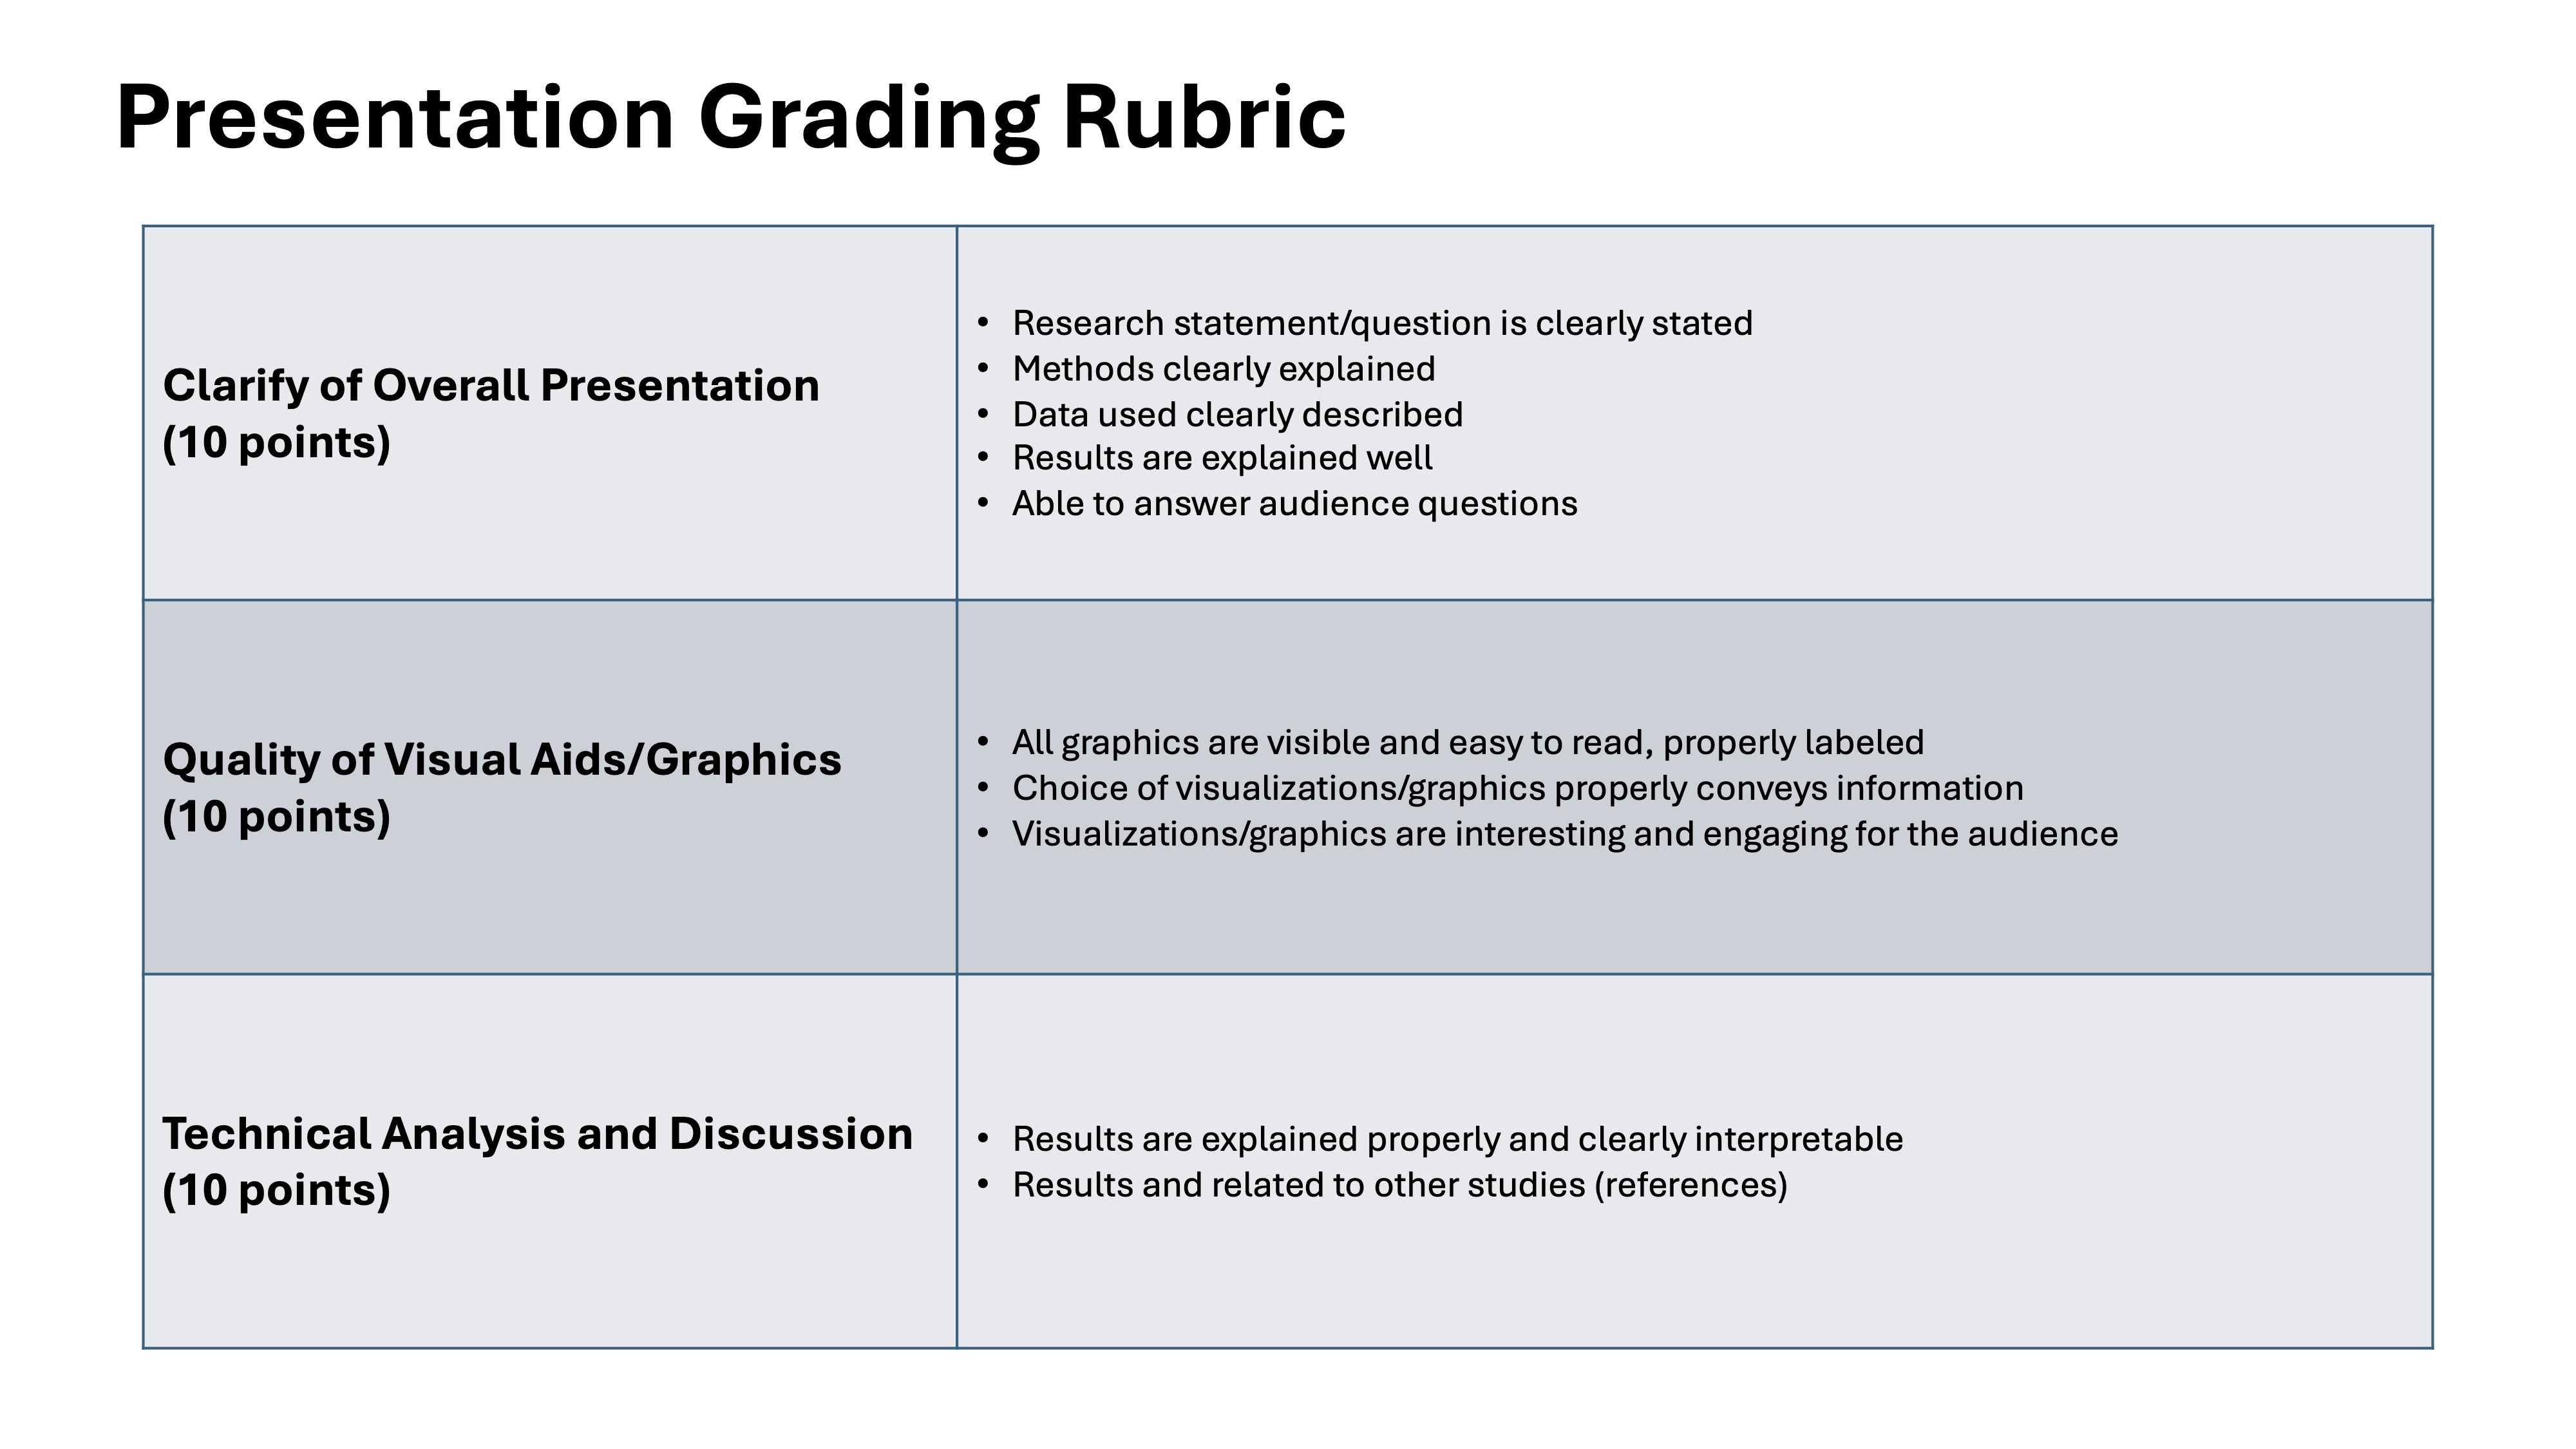
(20%) Final presentation#
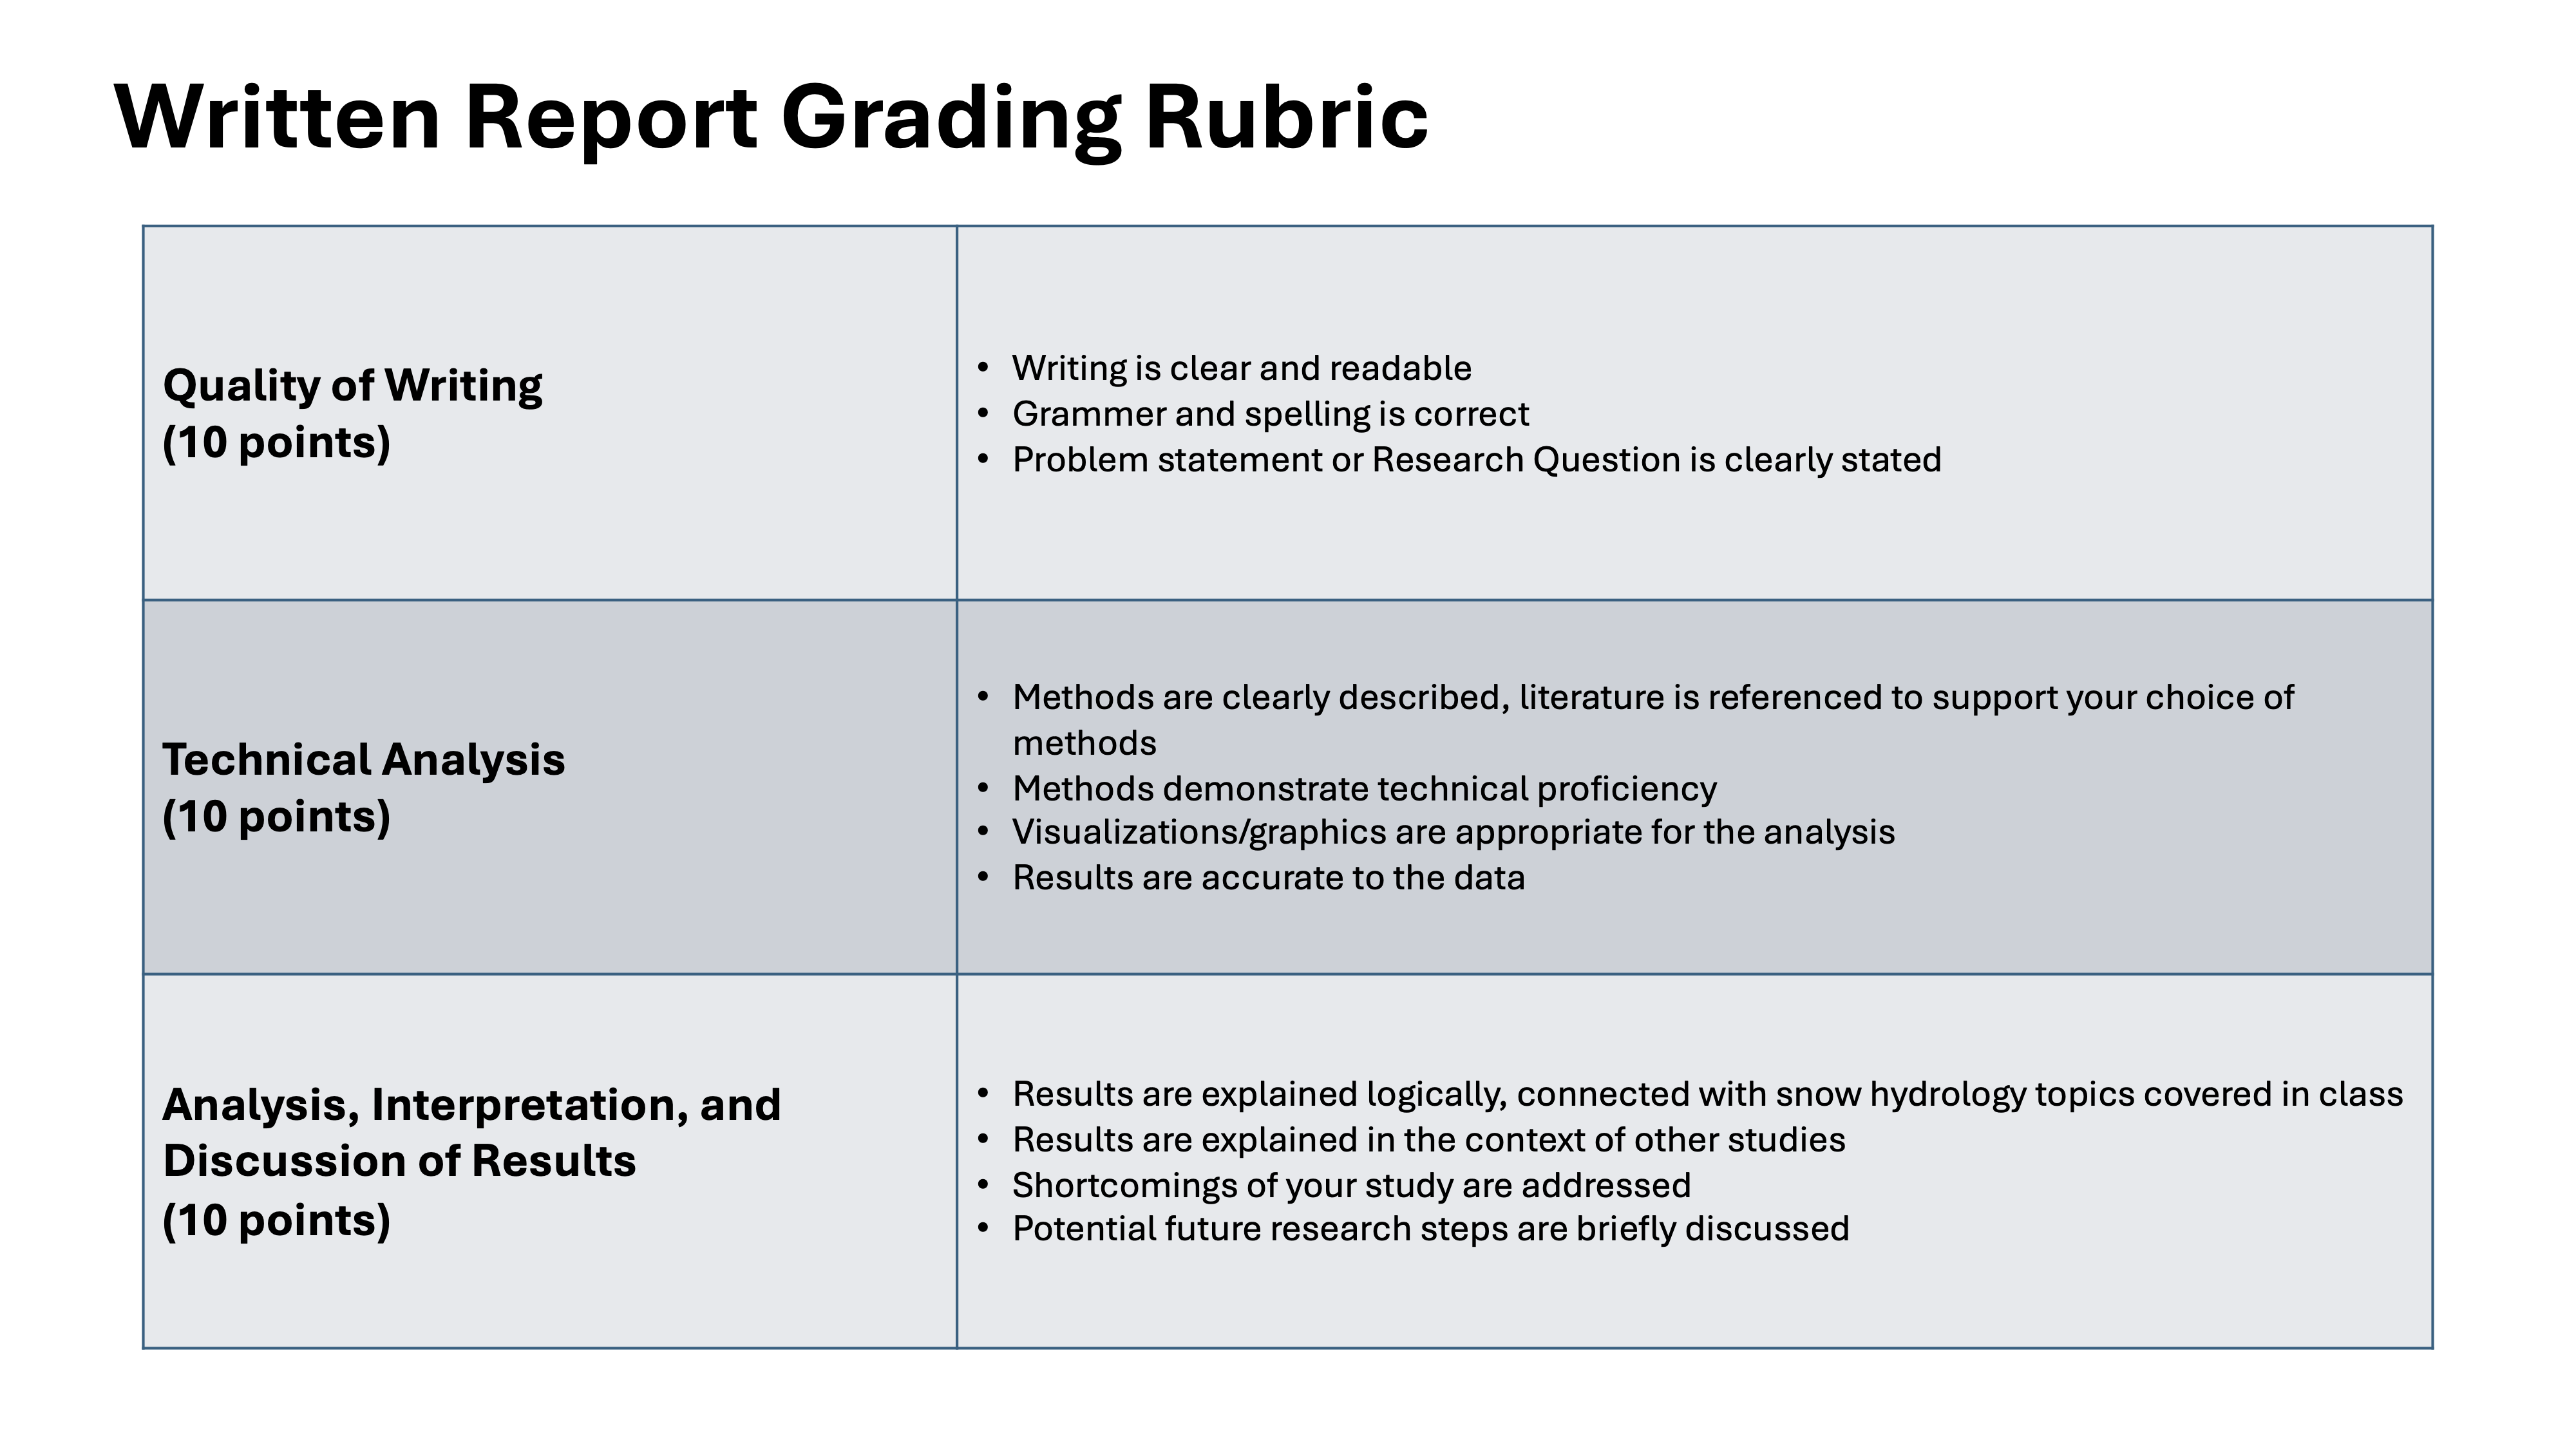
(80%) Final report#
The written report should include a clearly-stated research question, a methods section identifying the data and data analysis techniques utilized, and a results section describing your findings.
The report should contain at least three references to relevant scientific literature.
The report should be at least 3 pages long (excluding figures and references) and no longer than 10 pages, including figures and references.