Lab 4-4: Mann-Kendall Trend Test#
import numpy as np
import pandas as pd
import scipy.stats as st
import matplotlib.pyplot as plt
Load data.
snow_pillows = pd.read_csv('../data/pillows_example_2024.csv')
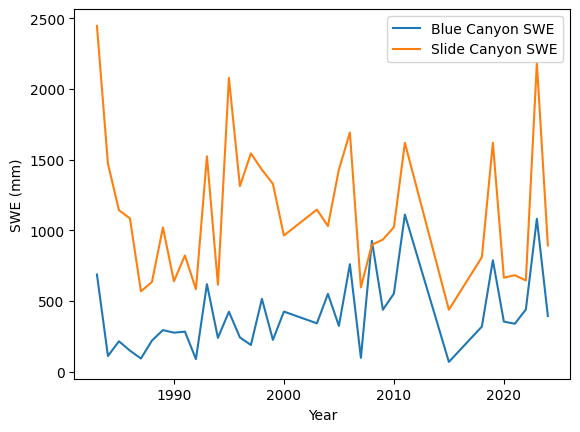
Plot the data
f, ax = plt.subplots()
snow_pillows.plot(x='years', y='BLC_max', linestyle='-', label='Blue Canyon SWE', ax=ax)
snow_pillows.plot(x='years', y='SLI_max', linestyle='-', label='Slide Canyon SWE', ax=ax)
plt.legend()
ax.set_xlabel('Year')
ax.set_ylabel('SWE (mm)');

Mann Kendall Test#
def mann_kendall(V, alpha=0.05):
    '''Mann Kendall Test (adapted from original Matlab function)
       Performs original Mann-Kendall test of the null hypothesis of trend absence in the vector V, against the alternative of trend.
       The result of the test is returned in reject_null:
       reject_null = True indicates a rejection of the null hypothesis at the alpha significance level.
       reject_null = False indicates a failure to reject the null hypothesis at the alpha significance level.

       INPUTS:
       V = time series [vector]
       alpha =  significance level of the test [scalar] (i.e. for 95% confidence, alpha=0.05)
       OUTPUTS:
       reject_null = True/False (True: reject the null hypothesis) (False: insufficient evidence to reject the null hypothesis)
       p_value = p-value of the test

       From Original Matlab Help Documentation:
       The significance level of a test is a threshold of probability a agreed to before the test is conducted.
       A typical value of alpha is 0.05. If the p-value of a test is less than alpha,
       the test rejects the null hypothesis. If the p-value is greater than alpha, there is insufficient evidence
       to reject the null hypothesis.
       The p-value of a test is the probability, under the null hypothesis, of obtaining a value
       of the test statistic as extreme or more extreme than the value computed from
       the sample.

       References
       Mann, H. B. (1945), Nonparametric tests against trend, Econometrica, 13, 245-259.
       Kendall, M. G. (1975), Rank Correlation Methods, Griffin, London.

       Original written by Simone Fatichi - simonef@dicea.unifi.it
       Copyright 2009
       Date: 2009/10/03
       modified: E.I. (1/12/2012)
       modified and converted to python: Steven Pestana - spestana@uw.edu (10/17/2019)
       '''

    V = np.reshape(V, (len(V), 1))
    alpha = alpha/2
    n = len(V)
    S = 0

    for i in range(0, n-1):
        for j in range(i+1, n):
            if V[j]>V[i]:
                S = S+1
            if V[j]<V[i]:
                S = S-1

    VarS = (n*(n-1)*(2*n+5))/18
    StdS = np.sqrt(VarS)
    # Ties are not considered

    # Kendall tau correction coefficient
    Kendall_Tau = S/(n*(n-1)/2)
    if S>=0:
        if S==0:
             Z = 0
        else:
            Z = ((S-1)/StdS)
    else:
        Z = (S+1)/StdS

    Zalpha = st.norm.ppf(1-alpha,0,1)
    p_value = 2*(1-st.norm.cdf(abs(Z), 0, 1)) #Two-tailed test p-value

    reject_null = abs(Z) > Zalpha # reject null hypothesis only if abs(Z) > Zalpha

    return reject_null, p_value
Run the Man Kendall tests#
alpha = 0.05

reject_null, p_value = mann_kendall(snow_pillows['SLI_max'].values, alpha)
print('Can we reject the null hypothesis for Slide Canyon?\n{}\n'.format(reject_null))

reject_null, p_value = mann_kendall(snow_pillows['BLC_max'].values, alpha)
print('Can we reject the null hypothesis for Blue Canyon?\n{}\n'.format(reject_null))
Can we reject the null hypothesis for Slide Canyon?
False

Can we reject the null hypothesis for Blue Canyon?
True
Food for Thought#
Blue Canyon is a lower elevation snow site in the Sierra Nevada (between Sacramento and Lake Tahoe) that gets both rain and snow. Slide Canyon is a much higher elevation snow site in Yosemite National Park that gets mostly snow.
If you read papers about climate change, they will tell you that warmer temperatures at lower elevations are decimating the snow, as snow changes to rain, but that higher, cooler elevations are less affected. So, why do we see an increasing trend in peak snow water equivalent at Blue Canyon but not at Slide Canyon? Can those papers and our data both be true?
