2) Atmospheric Structure and Thermodynamics
Recommended Reading For this week, we recommend reading Ch 2 and Ch 3 in Shuttleworth’s Terrestrial Hydrometerology.
## Lab 2: Plotting balloon soundings

Download the lab and data files to your computer. Then, upload them to your JupyterHub [following the instructions here](https://mountain-hydrology-research-group.github.io/Fluid_Flows/resources/b-learning-jupyter.html).

* Data: [Practice Data](/Fluid_Flows/modules/data/my_data.csv)
* Data: [Skykomish River Peak Flows, for plotting practice](/Fluid_Flows/modules/data/Skykomish_peak_flow_12134500_skykomish_river_near_gold_bar.xlsx)
* Data: [Sounding Data Dec 26](/Fluid_Flows/modules/data/2021-12-26_radiosonde.csv)
* Data: [Sounding Data Jan 03](/Fluid_Flows/modules/data/2022-01-03_radiosonde.csv)
* Data: [Sounding Data Jan 06](/Fluid_Flows/modules/data/2022-01-06_radiosonde.csv)
* Data: [Sounding Data Jan 10](/Fluid_Flows/modules/data/2022-01-10_radiosonde.csv)
* Graphic: [Ceilometer backscatter plot](/Fluid_Flows/modules/data/ceilometer_backscatter.png)
* [Lab 2-1: Practice Coding in a Jupyter Notebook](/Fluid_Flows/modules/lab2/lab2-1.ipynb)
* [Lab 2-2: Graphical Data Analysis - Practice Plotting Data](/Fluid_Flows/modules/lab2/lab2-2.ipynb)
* [Lab 2-3: Atmospheric Thermodynamics - Practice Plotting Sounding Data](/Fluid_Flows/modules/lab2/lab2-3.ipynb)
Homework 2
Problem 1
The air temperature outside in the evening is 20 °C, and the humidity is 75%. In the morning, you notice that there is dew on the ground. Presuming the water vapor content of the air did not significantly change, what was the minimum temperature overnight?
(Note: You may solve this using a Jupyter notebook following examples in the lab, or you may use a pen/pencil and paper.)
Problem 2
Three cities have the following temperature (T) and dew point (Td) during a March afternoon:
| city | temperature | dew point temperature |
|---|---|---|
| Death Valley, CA | T = 24°C | Td = -4°C |
| Seattle, WA | T = 11°C | Td = 7°C |
| Spokane, WA | T = 8°C | Td = 3°C |
| Taos, NM | T= -1°C | Td= -2°C |
Which city has
- (a) the highest relative humidity?
- (b) the lowest relative humidity?
- (c) the most water vapor?
- (d) the least water vapor?
(Note: You may solve this using a Jupyter notebook following examples in the lab, or you may use a pen/pencil and paper.)
Problem 3 (option 1: choose this if you dislike python)
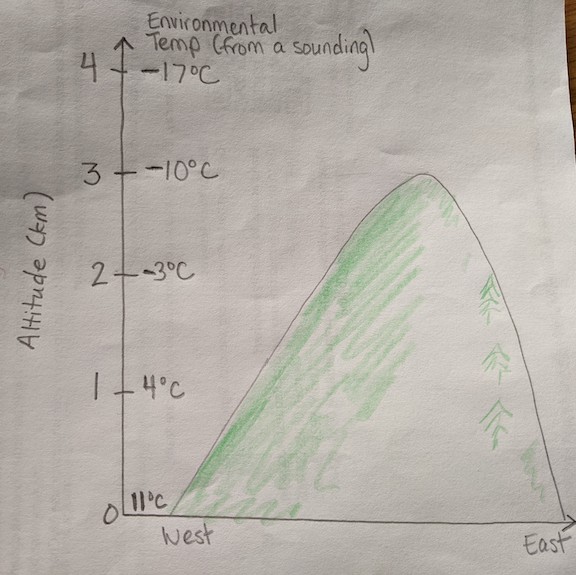
The figure below shows environmental temperature data on the west side of a conical mountain. Suppose the wind is blowing from the west and a parcel of surface air with a temperature of 11°C and a dew point of 7°C begins to rise upward along the western (windward) side of the hill.
- (a) Calculate the environmental lapse rate
- (b) What type of atmospheric stability does the sounding indicate?
- (c) What is the relative humidity of the air parcel at 0 m before rising?
- (d) As the air parcel rises, at approximately what elevation would condensation begin and a cloud start to form?
- (e) What is the air temperature and dew point of the rising air at the base of the cloud?
- (f) What is the air temperature and dew point of the rising air inside the cloud at an elevation of 3000m?
- (g) At an altitude of 3000m, how does the air temperature inside the cloud compare with the temperature outside the cloud? What type of atmospheric stability does this suggest?
- (h) Presume that at 3000m, the parcel has reached the top of the mountain, and rained/snowed enough to become a dry air parcel again. At what lapse rate will the parcel descend to the east of the mountains?
- (i) What temperature do you expect this air to be when it reaches 1000m on the eastern side?
Problem 3 (option 2: choose this if you want to use python)
Using the jupyterhub, and building off what we learned in lab 2-3, look at the environmental temperature and relative humidity data from the sounding launched in Gothic, Colorado on January 6, 2022.
- (a) Calculate the environmental lapse rate
- (b) Assuming the lowest level of the sounding represents the surface temperature and relative humidity, plot the temperature a dry air parcel would have if it were lifted adibatically from that point
- (c) What is the dew point temperature of the parcel at the surface?
- (d) Assuming that the dew point temperature decreases with elevation at a rate of 2 K/km (2°C/km), at what elevation would estimate that a cloud would form? (Hint: Plot this line on your graph from Td at the surface with the dry adiabat plotted from T at the surface.)
- (e) How does this height compare with the base height where a cloud seems to exist in this sounding?
- (f) How do both of these compare with the base height as estimated from the plot from the ceilometer in the lab?
- (g) At a height of 5000 m, how does the air temperature estimated from your rising parcel of air compare to the observed air temperature? What type of atmospheric stability does this suggest?
Problem 4
What is the definition of an inversion, and how does it relate to atmospheric stability? Draw a graph of environmental temperature vs height that is conditionally unstable near the surface but has a strong inversion at a height of 1000 m. Explain how a non-reactive pollutant released at the surface would mix within this atmosphere for case (a) where the surface is very dry and case (b) where the surface is near saturated (close to 100% relative humidity).
Problem 5: Final Presentation Topic Selection
Look at the list of topics here. Write a ranked list (from 1st choice to 10th choice) of your preference for topics. If you only have strong preferences for 5, it’s okay to rank from 1st to 5th (but please include at least 5). If you have questions about the project or the topics, please talk to the instructor.