5) Turbulent transport - momentum, heat, and moisture fluxes above the snow covered earth
External resources.
For a good introductory text, on fluxes of sensible and latent heat above the earth’s surface, we recommend Terrestrial Hydrometeorology by W. James Shuttleworth. In particular, Chapters 15-19 on turbulence are helpful with this week’s lessons. Chapter 2 on water vapor in the atmosphere and Chapter 3 on vertical gradients in the atmosphere may also be useful.
Modeling turbulent fluxes
Turbulent transport of momentum, heat, and moisture above a snow surface are estimated by eddy covariance fluxes. We are especially interested in heat fluxes. Sensible heat, in units of watts/m^2 is written
\[H_s = \rho_{air} c_p^{air} \overline{w'T'}\]where the first term is air density, the second term is the specific heat capacity of air, and the third term is the eddy covariance flux of temperature (sensible heat). w’ is a vertical velocity flucutation and T’ is a temperature fluctuation.
Latent heat, in units of watts/m^2 is written
\[H_L = L_v \overline{w'q'}\]where the first term is the latent heat of sublimation and the second term is the eddy covariance flux of water vapor. q is a water vapor density (AKA absolute humidity, g/m^3) fluctuation.
The covariance flux terms in the equations above can be predicted using Monin Obukhov Similarity Theory (MOST). Here, we will present the equations that form the “bulk aerodynamic” method for estimating turbulent fluxes. The bulk aerodynamic method is a simplified, easily solvable version of MOST.
Sensible heat flux is calculated
\[H_s = - \rho_{air} c_p^{air} C_H u_h (\theta_h - \theta_s)\]or
\[\overline{w'T'} = - C_H u_h (\theta_h - \theta_s)\]where uₕ, θₕ, and θₛ are wind speed at measurement height h, potential temperature at h, and potential temperature at the snow surface. and latent heat flux is calculated
\[H_L = - L_v C_L u_h (q_h - q_s)\]or
\[\overline{w'q'} = - C_L u_h (q_h - q_s)\]where qₕ and qₛ are absolute humidity at measurement height h and at the snow surface.
The transfer coefficents CH CL can be calculated in many different ways with varying levels of complexity. We present one of the simplest methods, where CH = CL.
\[C_H = \frac{k^2}{\Big(ln(\frac{h}{z_o})\Big)^2} \Big(1 - \frac{Ri}{0.2}\Big)\]where k is the von Kármán constant (0.4), z0 is the roughness length (over snow, often assumed to be 0.0002 m). Ri is the Richardson number, a dimensionless number that describes the dynamic stability of the atmosphere. The Richardson number can be approximated as the “bulk” Richardson number,
\[Ri = \frac{g h (\theta_h - \theta_s)}{u_h^2 0.5(\theta_h + \theta_s)}\]To estimate Hs and HL, assemble the equations above.
Measuring turbulent fluxes
An Eddy Covariance system is used to measure turbulent fluxes in the atmosphere (and in the water too). These systems use two instruments - a sonic anemometer to measure 3D wind speeds and temperature and a gas analyzer to measure water vapor and CO2 concentrations, both at a rapid rate (10-20Hz). From the rapid time series measurements, we can perform Reynolds averaging, calculate mean and fluctuation components of w, T, and q, and then calculate the covariances w’T’ and w’q’, which represent fluxes of sensible and latent heat, respectively.
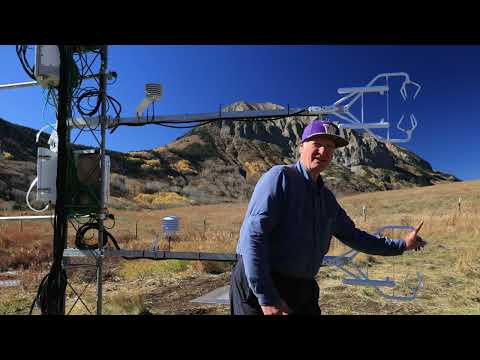 Click on the photo above to hear Steve Oncley, recently retired from NCAR’s Earth Observing laboratory, explain how the EC150 sonic anemometers work.
This week we will be using data from these sensors to study turbulent transfer or heat, moisture, and momentum.
## Lab 5: Turbulent fluxes
* [Lab 5-1](/snow-hydrology/modules/lab5/lab5-1.ipynb)
* [Lab 5-2](/snow-hydrology/modules/lab5/lab5-2.ipynb)
* [Lab 5-3](/snow-hydrology/modules/lab5/lab5-3.ipynb)
* [SoS dataset](/snow-hydrology/modules/data/sos_full_dataset_30min.nc)
Homework 5
Implement the bulk aerodynamic method described above to predict sensible and latent heat fluxes from the available measurements. Note that you should use the following variables from the datasets:
Tpot_3m_c
Tsurfpot_c
mixingratio_3m_c
dryairdensity_3m_c
Tsurfmixingratio_c
Tsurfdryairdensity_c
spd_3m_c
Perform the following steps/answer the following questions:
- Create a scatter plot of measured sensible heat flux (
w_tc__3m_c) versus modeled sensible heat flux from the entire season (modeled on the x axis, measured on the y axis). Briefly describe the performance of the model. Keep your measurements in their native units (˚C * m/s) - Create a scatter plot of measured latent heat flux (
w_h2o__3m_c) versus modeled latent heat flux from the entire season (modeled on the x axis, measured on the y axis). Briefly describe the performance of the model. Keep your measurements in their native units (g/m^2/s) - Modify the z0 value until your fit improves. Write the final z0 value you settled on. How does it differ from the z0 value that I suggested above (0.0002)?
- Plot time series of modeled and measured sensible heat flux and latent heat flux for the first 4 days of January. Create a similar plot for the first 4 days of June. Describe why you think the performance is better in one month versus the other.
- Take all of your measured and predicted/modeled values from the season, and create two separate datasets, one that includes data from a) between 10pm and 2am, and b) between 11am and 3pm. Create scatterplots of modeled versus measured sensible heat and latent heat fluxes (like in problems 1 and 2) for the two separate datasets (as in problems 1 and 2).
- Explain why you think the performance differs between the two time periods (night versus day).
- Using data from the whole season, create a time series plot of cumulative sublimation with two lines, one using measured values and one using modeled values. Describe how the measured and modeled total sublimation differs. Note that latent heat flux is approximately equal to the sublimation rate. Latent heat flux, in units of g/m^2/s, when summed over the season, should be converted to g/m^2. That means you need to multiply each time step by the number of seconds in that timestep, to convert the latent heat flux (aka sublimation rate) into a total amount of water sublimated. So a 30-minute flux (units g/m^2/s) is multipled by 1800s (number of seconds in 30 minutes), to produce a measure of “total sublimation in this 30-minute period”, in units g/m^2.